Mar.10 Informal Response
Victoria Yuanyuan Chang
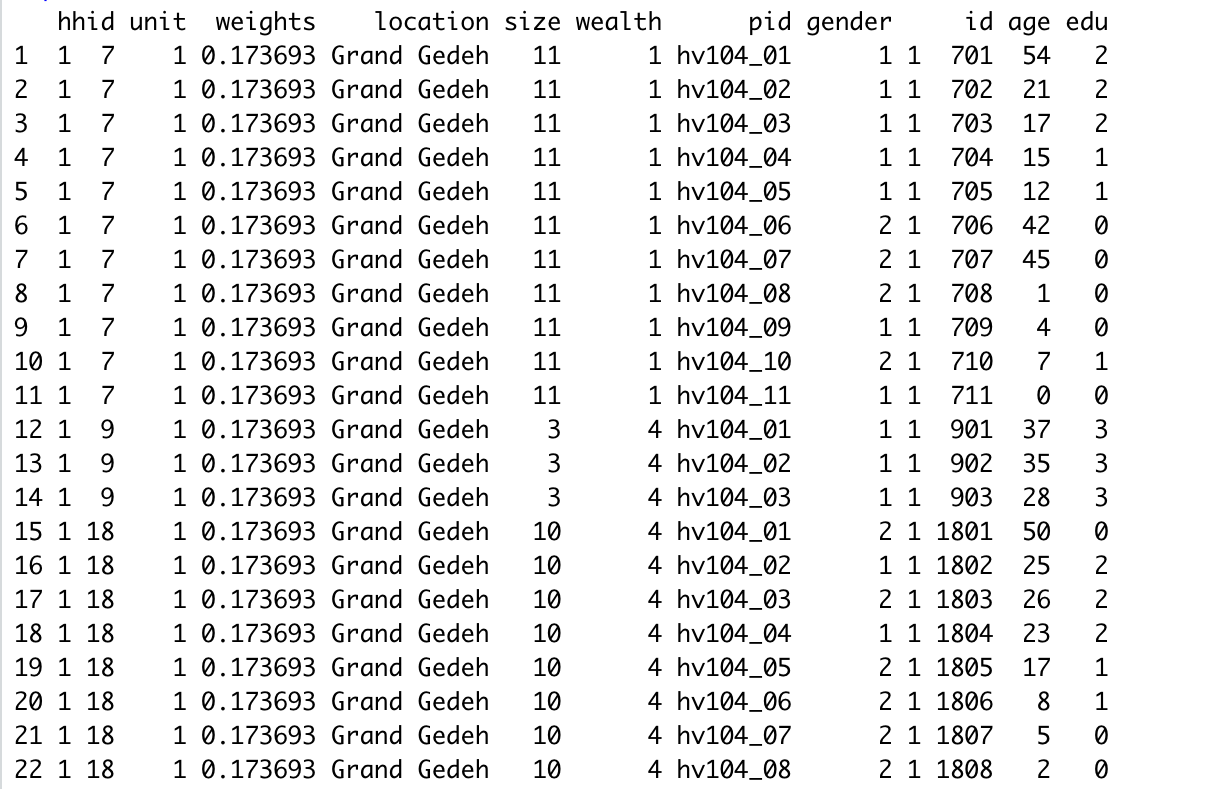
Import the households dataset for your selected country and create a data frame with a variable that describes each of the following.
household ID, unit, weights, location, size, gender, age, education, wealth.
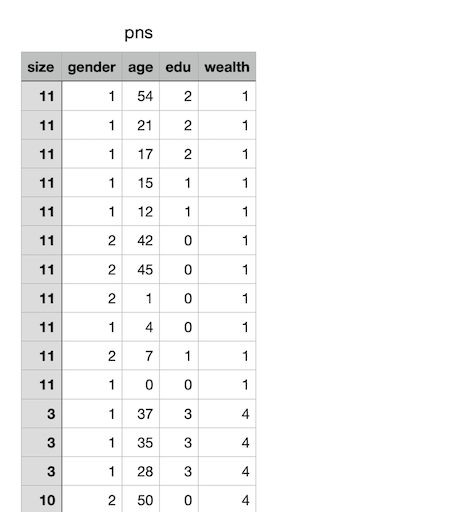
Pivot the persons columns within your households data to a long format in order to produce a similarly specified dataset that describes all persons residing within all households.
The resulting dataframe is the following:
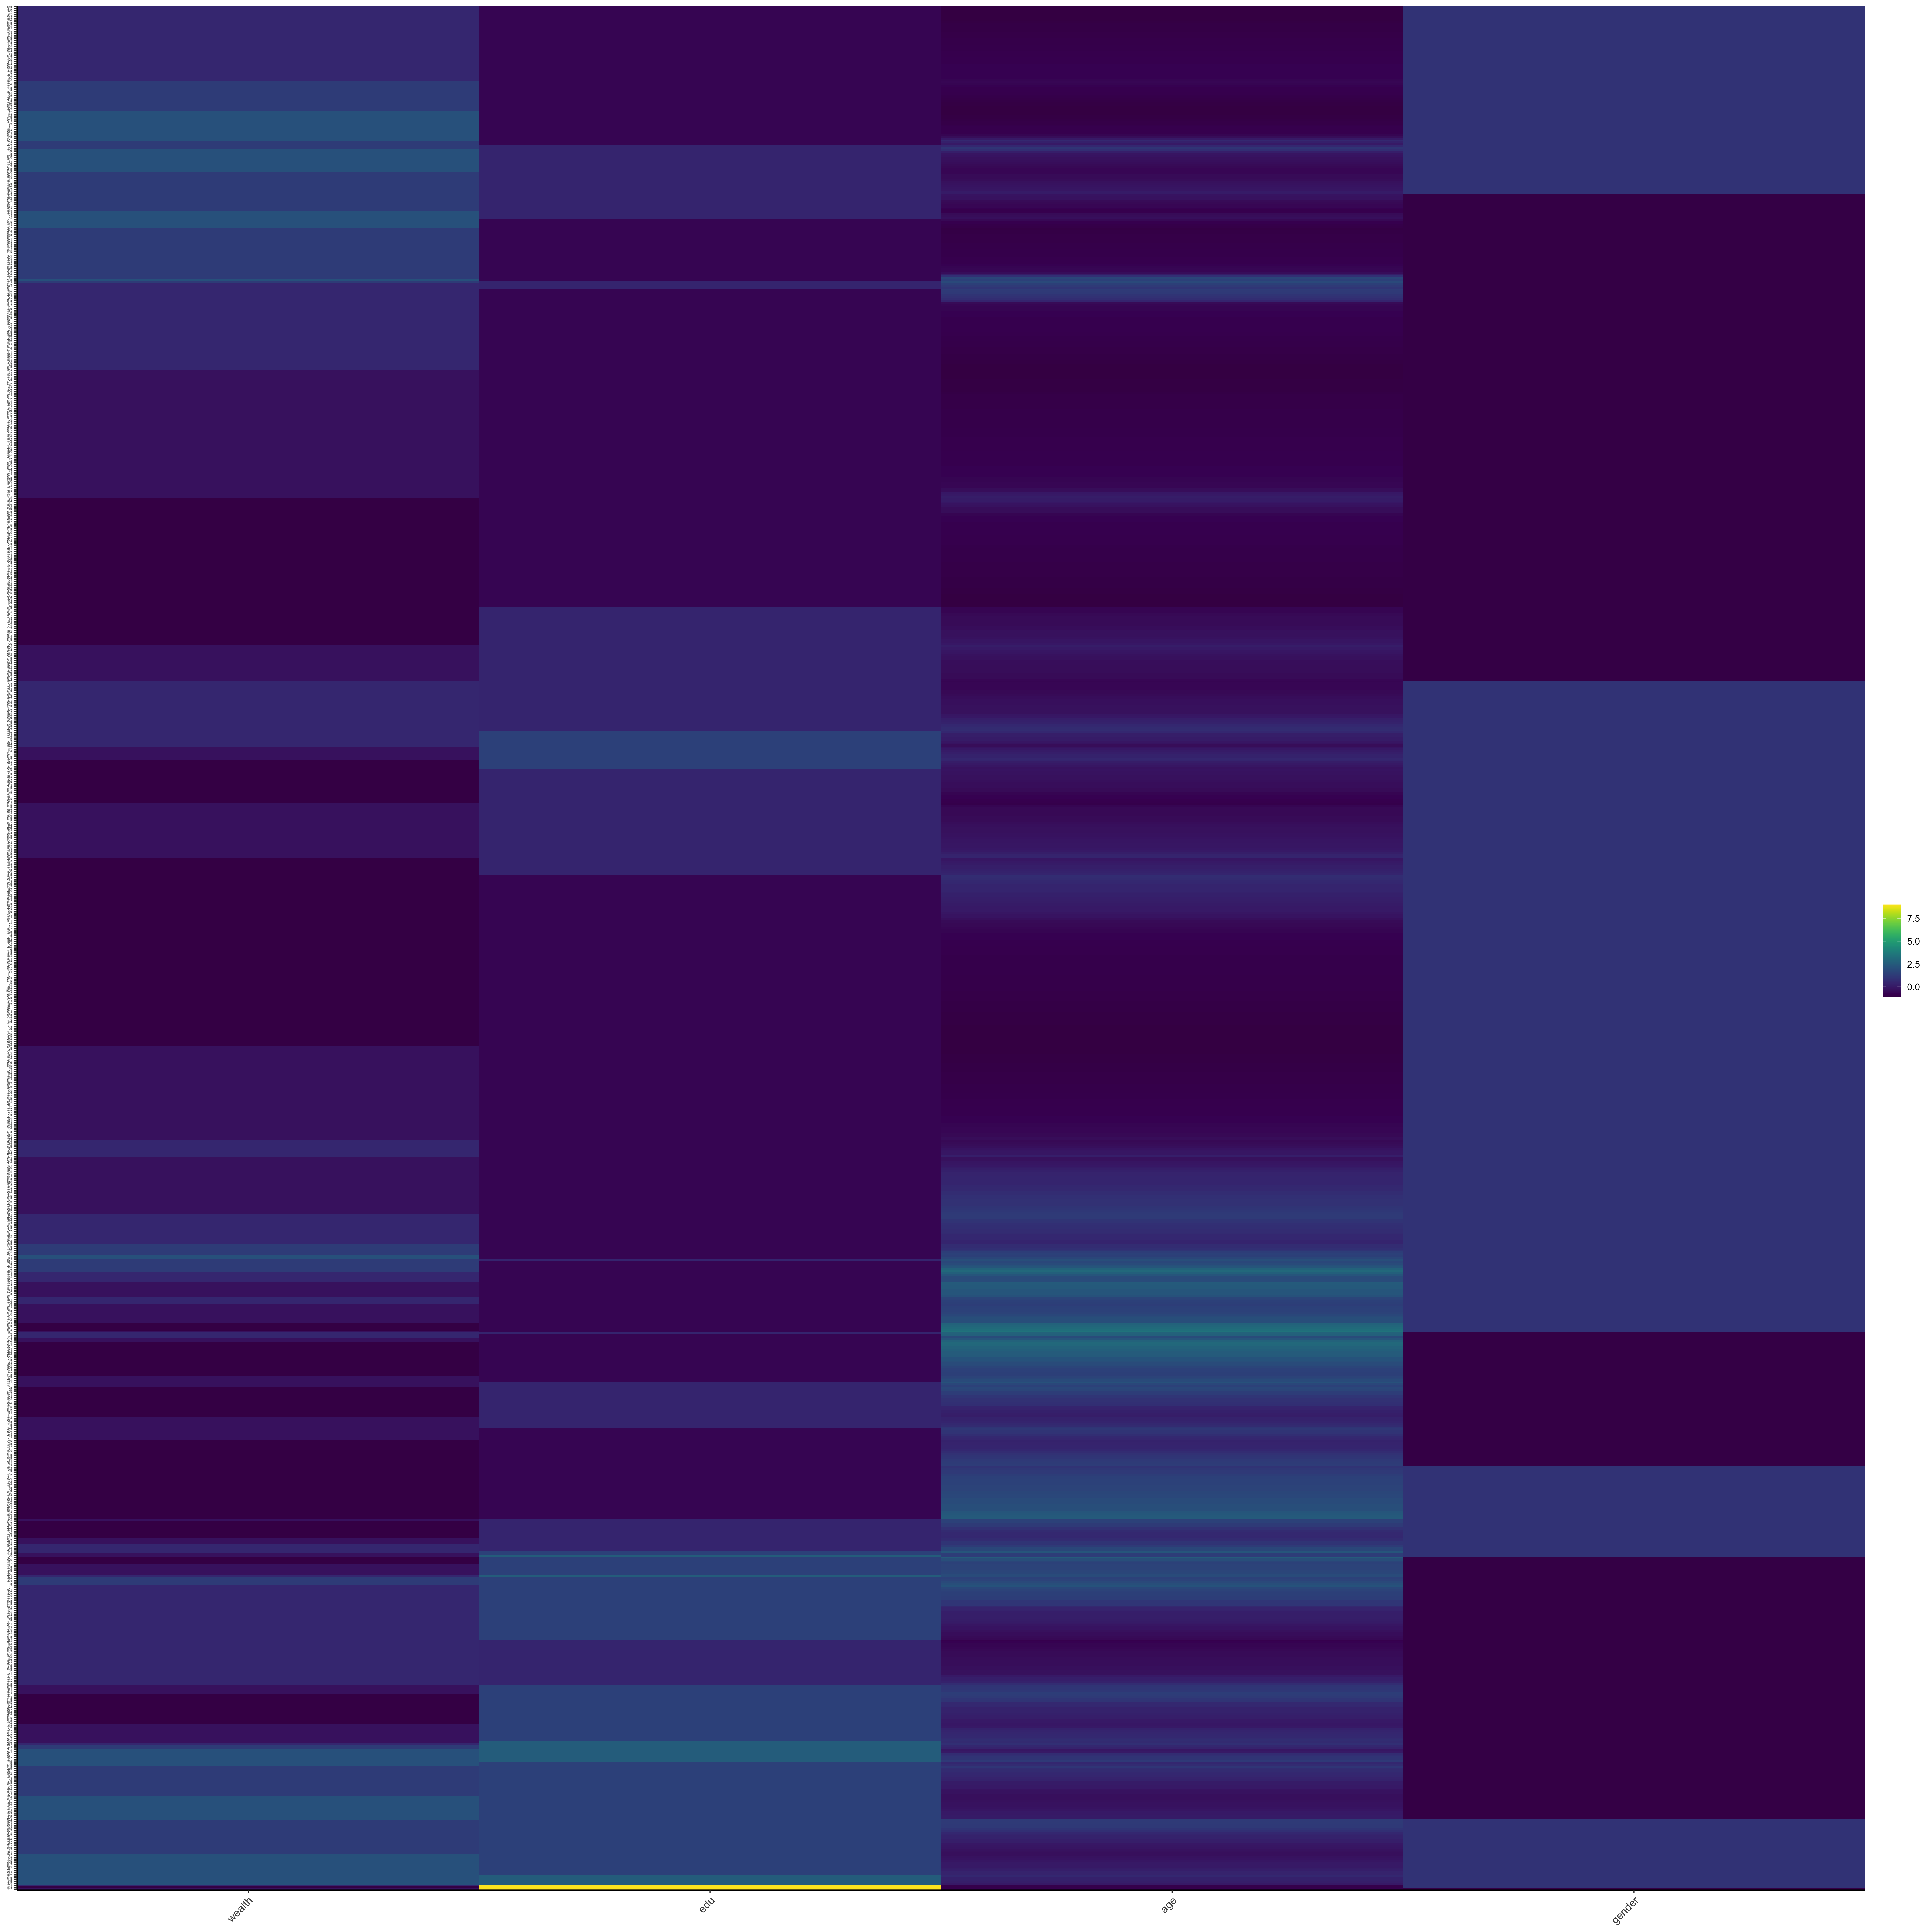
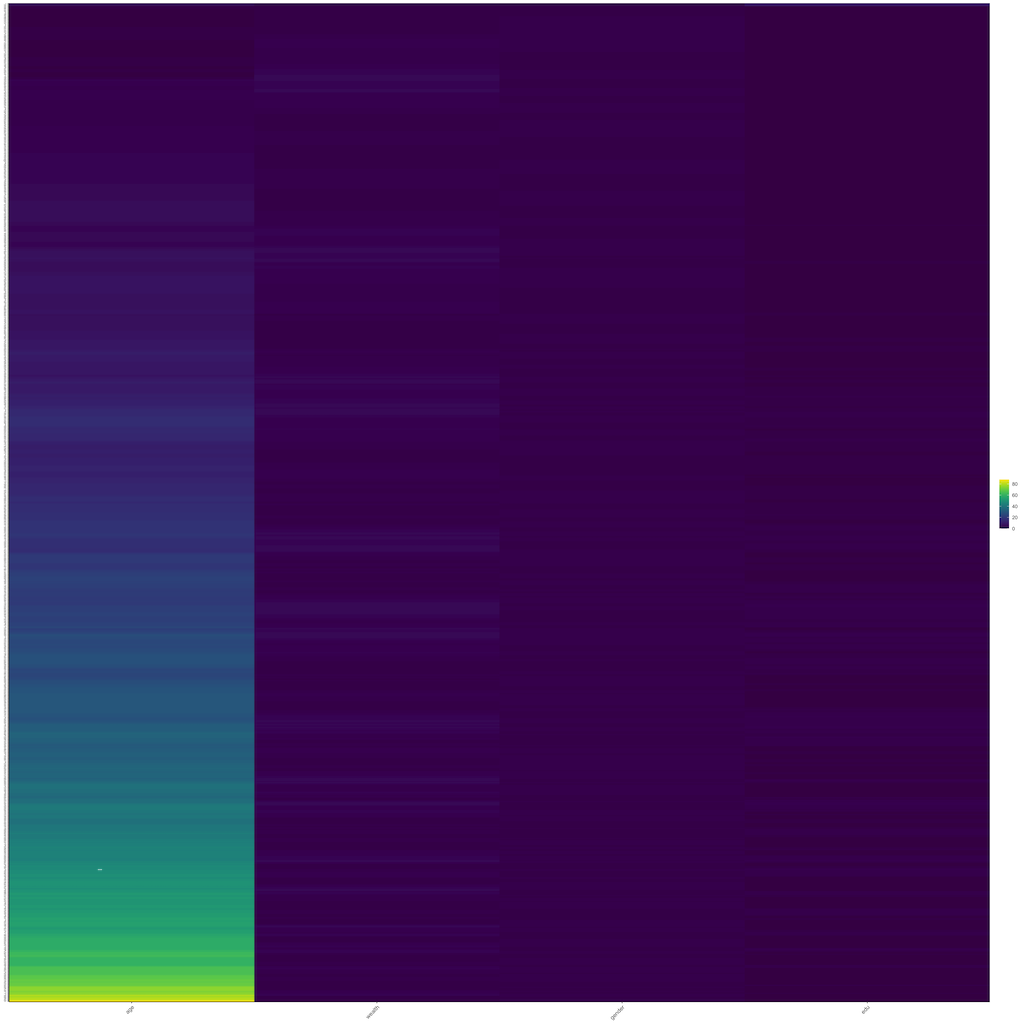
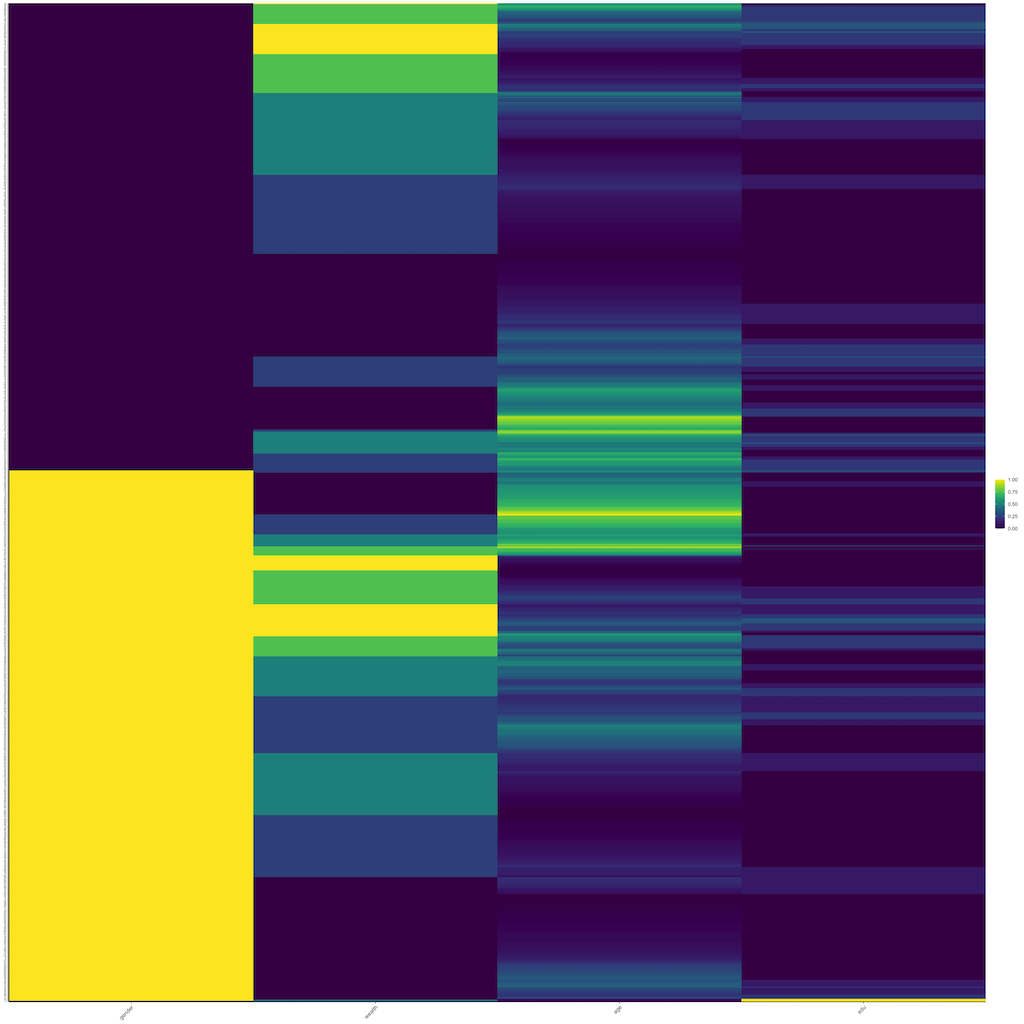
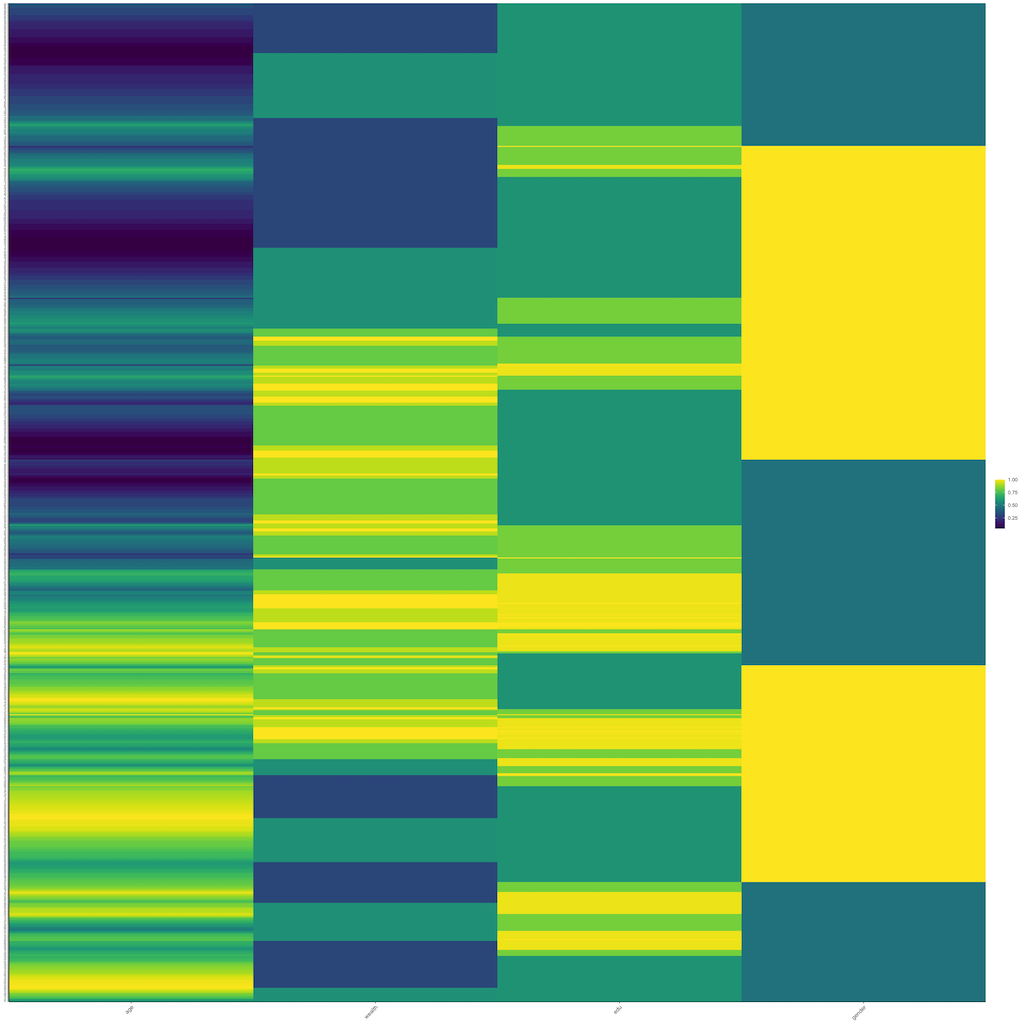
Using this data frame describing all persons standardize, normalize and percentize your variables and visualize each post transformed dataset as a heatmap that illustrates the heterogeneity of the combination of patterns.
Visuallized heatmaps are the following:
- Raw
- Normalized
- Percentized
- Scale